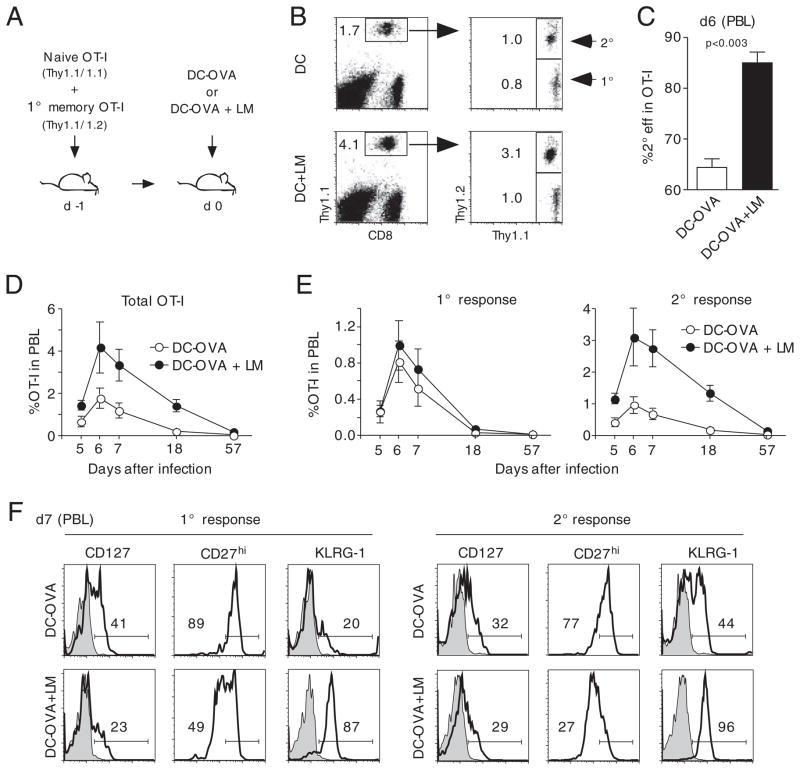
Figure 6.
Systemic inflammation increases 2° effector CD8+ T-cell numbers and induces a sustained effector phenotype. (A) Experimental setup: 5 × 10² Thy1.1 naïve and 1 × 10⁴ 1° memory OT-I cells were mixed and injected into naïve Thy1.2 hosts (n = 10) prior to immunization with OVA-coated DCs. One group of mice was coinfected with att LM. (B) Detection of Thy1.1+ OT-I cells (left dot plots) and discrimination between 2° (Thy1.1/1.2) and 1° (Thy1.1) OT-I cell responses (right dot plots). Numbers show the frequency of OT-I T cells in PBL in representative mice. (C) Percentage of 2° effector OT-I cells in the total OT-I cell population (mean+SEM). (D) Kinetics of the total OT-I cell response in PBL (mean±SEM). (E) Kinetics of the 1° (left graph) and 2° (right graph) OT-I cell response in PBL (mean±SEM). (F) Phenotype of 1° (left side) and 2° (right side) effector OT-I cells was analyzed in pooled PBL from up to ten mice. Shaded histograms represent isotype controls. The experiment was repeated once with similar results. Data are representative of two independent experiments.

