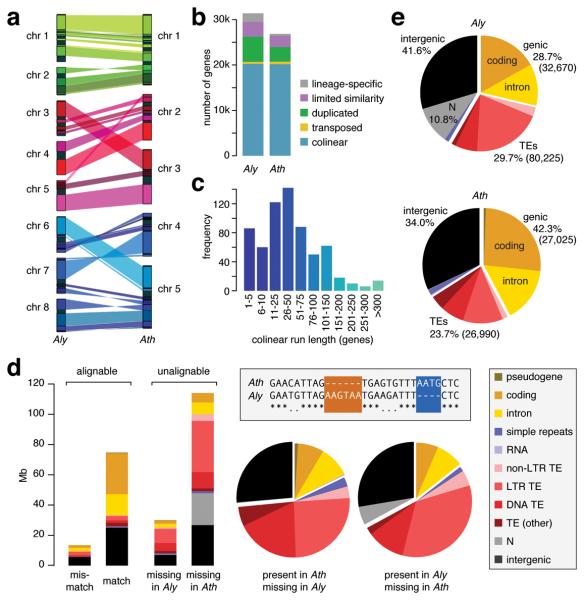
Figure 1.
Comparison of A. lyrata and A. thaliana genomes. (a) Alignment of A. lyrata (Aly) and A. thaliana (Ath) chromosomes. Genomes are scaled to equal size. Only syntenic blocks of at least 500 kb are connected. (b) Orthology classification of genes. (c) Distribution of run lengths of collinear genes. The mode at 1-5 reflects frequent single-gene transpositions. (d) Unalignable sites can be considered as present in one species and absent in the other, as shown in the boxed sequence diagram; matches are indicated by asterisks, and mismatches by periods. The histogram on the left indicates the absolute number of unalignable sites, and the pie charts in the middle compare their relative distribution over different genomic features. See also Supplementary Table 3. (e) Genome composition (number of elements in parentheses).

