Figure 5.
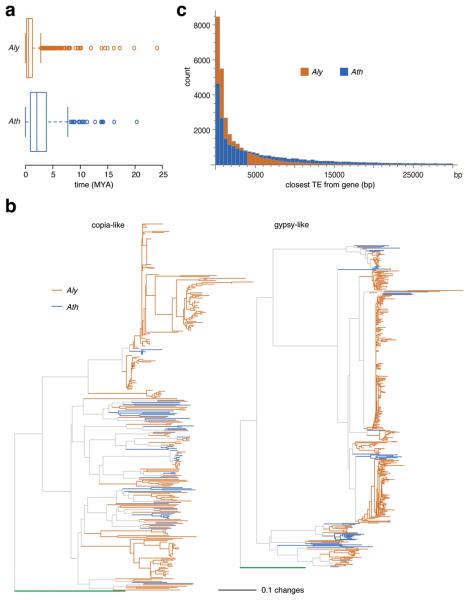
Comparison of transposable elements. (a) Estimated insertion times of LTR retrotransposons, based on the experimentally determined mutation rate for A. thaliana. The whiskers indicate values up to 1.5 times the interquartile range. The difference between the species is highly significant (Wilcoxon rank sum test, p<2.2×10⁻¹⁶). (b) Phylogeny of Ty1/copia-like and Ty3/gypsy-like LTR retrotransposons. S. cerevisiae Ty1 and Ty3 used as outgroups are indicated in green. (c) Distances of nearest TE from each gene. The difference between the two species is not simply due to fewer transposable elements in the A. thaliana genome (Supplementary Table 8 and Supplementary Fig. 7).

