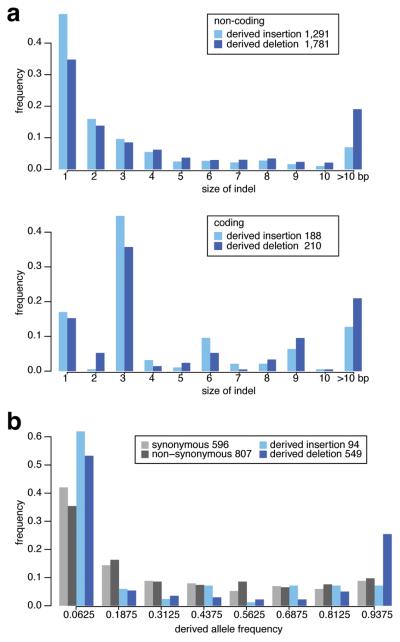
Figure 6.
Sizes and allele frequency distribution of insertions and deletions that are either fixed or still segregating in 95 A. thaliana individuals43 and that are presumed to be derived based on comparison with the A. lyrata allele. (a) Size distribution of fixed insertions and deletions. Insertions and deletions that are multiples of a single codon (3 bp) are overrepresented in coding regions. (b) Allele frequency of segregating non-coding insertion and deletion frequencies compared to that of synonymous and non-synonymous polymorphisms.

