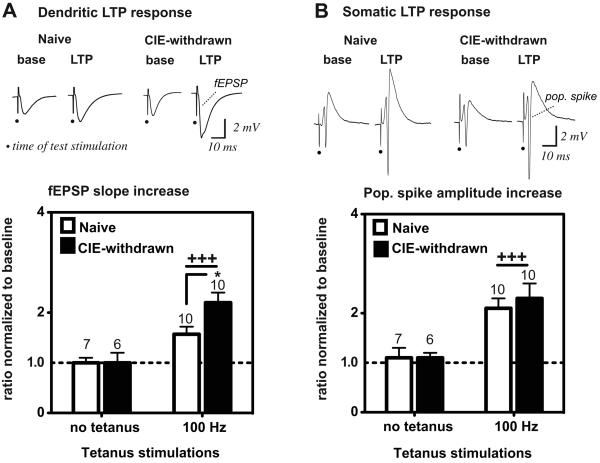
Figure 1.
Comparison of LTP magnitudes at dendritic synapses (A) and soma (B) of CA1 neurons in naïve versus CIE-withdrawn hippocampal slices. Top traces are evoked fEPSPs (A) and pop. spike signals (B) in a representative naïve control or CIE-withdrawn slice recorded at baseline (base) and 60 min after high-frequency stimulations (100 Hz, 1 s duration, 3 trains, 20 s inter-train interval). Test stimulations were applied at an intensity evoking the near half-maximal pop. spike response amplitude at baseline (applied voltage: naïve control, 15 ± 2 V and CIE-withdrawn, 15 ± 1 V). Dots denote the time of the test stimulations. Bar graphs represent the mean response magnitude at 55-60 min after or in the absence of the 100 Hz stimulations, as normalized to the mean baseline response (i.e., the ratio between the mean of 5 consecutive response magnitudes at the two time points). A ratio of 1 (dashed line) would indicate no change in the evoked response from baseline. Mean values ± SEM are shown for the indicated number of slices. +++, p < 0.001 no tetanus versus 100 Hz tetanus and *, p < 0.05 CIE-withdrawn versus Naive (100 Hz) by Bonferroni post t-test comparisons.

