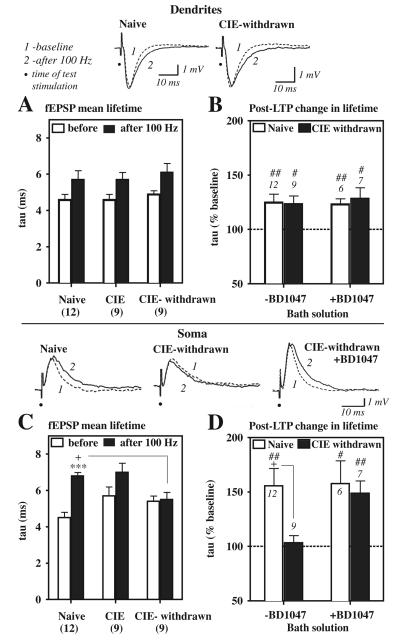
Figure 5.
fEPSP decay time course at CA1 soma is prolonged by LTP in naive control but not CIE-withdrawn slices. Data are decay time constants (tau or mean lifetime) for the evoked dendritic (A, B) and somatic (C, D) fEPSPs before (baseline) and at 60 min after the 100 Hz stimulations. Top traces are example fEPSP waveforms before (1, dashed curve) and after (2, solid curve) in a representative naïve or CIE-withdrawn slice. Note the slowing of the somatic fEPSP decay time course after LTP induction in the naive but not the CIE-withdrawn slice (first versus middle trace in bottom panel). A, C, Mean tau values for time-locked dendritic (A) and somatic (C) fEPSP signals in naïve control, CIE non-withdrawn (‘CIE’), and CIE-withdrawn slices. fEPSPs near threshold were selected that were not contaminated by the presence of a pop. spike and matched with respect to their dendritic fEPSP slope for tau determinations. B, D, Mean percentage increase in the tau value at 60 min after LTP induction in slices pretreated (+) with BD1047 (1 μM), as compared to control slices not exposed to BD1047 (−BD1047) from data shown in A and C. Dashed line at 100% would indicate no change in the fEPSP mean lifetime from baseline. Data are the indicated number of slices from a subset recorded in Fig. 2E, 3B, and 5F. ##, p < 0.01 and #, p < 0.05 versus 100% by a one-sample t-test (B, D). ***, p < 0.001 naïve, ‘before’ versus ‘after 100 Hz’ (C). +, p < 0.05 Naive versus CIE-withdrawn (C and D).

