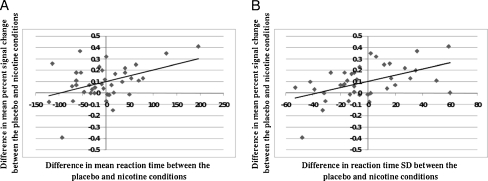
Fig. 3.
Scatter plots showing the relationship between fMRI BOLD and behavioral responses to nicotine. a The difference in mean reaction time (RT) and the difference in mean percent signal (BOLD in the placebo vs nicotine ROI between the placebo and nicotine conditions. Difference values were calculated by subtracting the value for the placebo condition from the value for the nicotine condition. For mean percent signal change, a negative difference value represents a decrease in activation from placebo to nicotine. A positive value represents an increase from placebo to nicotine. For mean RT, a negative value indicates a reduction in reaction time from placebo to nicotine and a positive value represents an increase in reaction time from placebo to nicotine. A decrease in reaction time from placebo to nicotine is related to a decrease in BOLD activation from placebo to nicotine (b). The difference in reaction time standard deviation (RT_SD) and the difference in mean percent signal change in the placebo vs nicotine ROI between the placebo and nicotine conditions. For RT_SD, a negative value indicates a reduction in reaction time variability from placebo to nicotine and a positive value represents an increase in reaction time variability from placebo to nicotine. A decrease in reaction time variability from placebo to nicotine is related to a decrease in BOLD activation from placebo to nicotine

