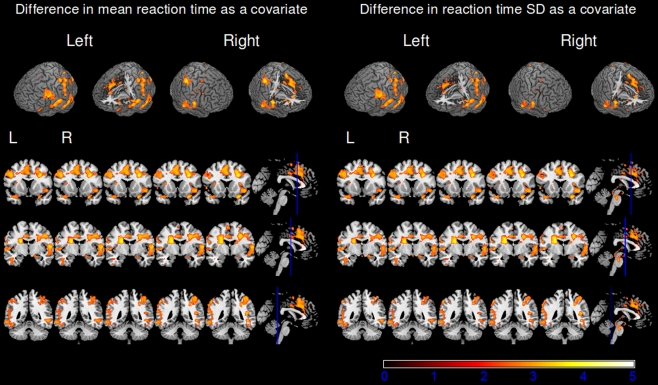
Fig. 4.
BOLD activation for the placebo versus nicotine contrast with reaction time data included as a covariate (second-level mixed-effects FLAME, N = 39, cluster-corrected threshold Z = 2.3, p = 0.05). The left panel shows activation associated with the nicotine effects on mean reaction time. The right panel shows activation associated with the nicotine effects on reaction time standard deviation

