
Figure 6.
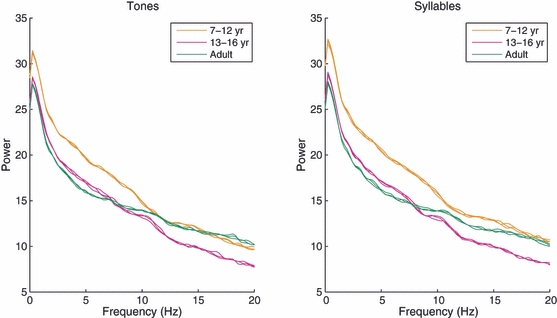
Power (dB) relative to frequency (Hz) for difference waves in relation to age. The plot shows three lines for each age corresponding to dummy waves and two kinds of mismatch wave, but these are not differentiated by symbols, as they are virtually superimposed.