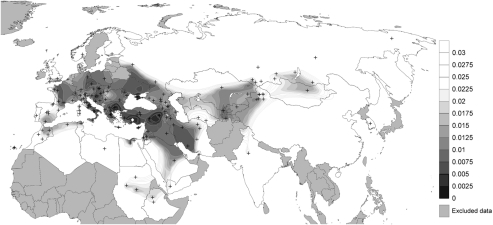
Figure 3.
Spatial distribution of the Fst values calculated from the pairwise comparison of the Sagalassos mtDNAs (HVS-I) with those of 157 populations from Eurasia and North Africa (Supplementary Table 2). Fst values as reported in the Supplementary Table 7, follow the gray scale. Black crosses indicate the geographic location of the populations surveyed.

