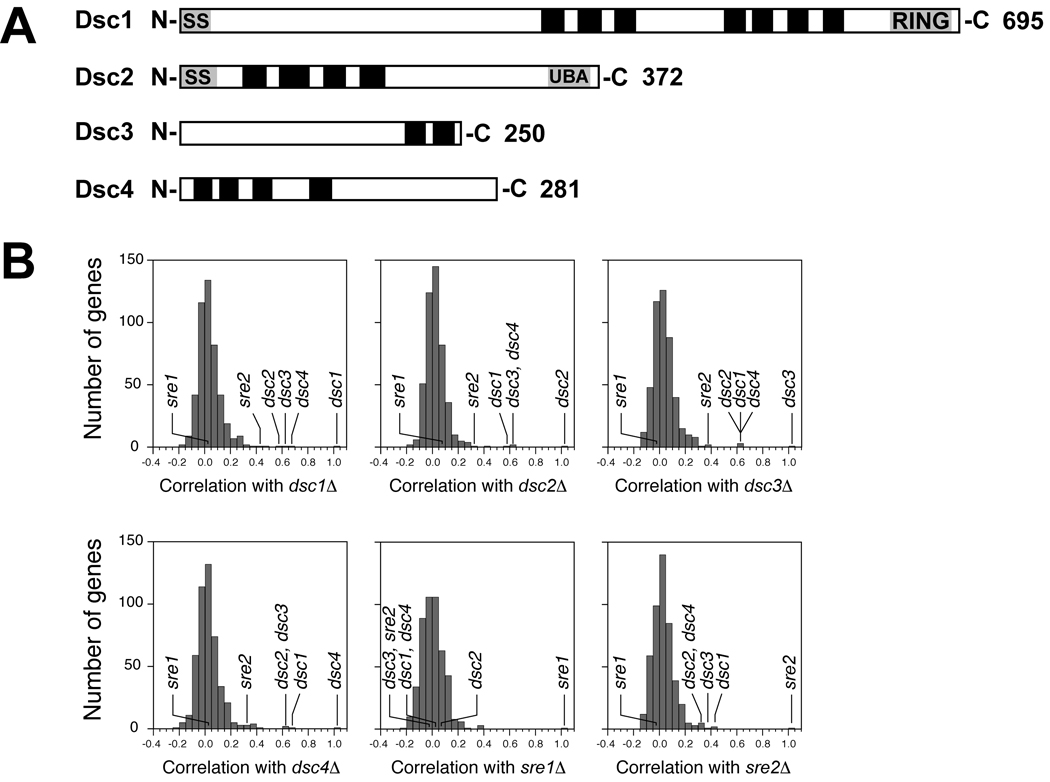
Figure 2. E-MAP analysis reveals a conserved function for the Dsc proteins.
(A) Diagrams of Dsc proteins where black boxes represent predicted transmembrane domains. Predicted signal sequences and conserved domains are indicated. (B) Histograms of correlation coefficients calculated by comparing the genetic interactions of 471 query mutants mated against a library of 2,277 nonessential deletions. Histograms for dsc1Δ, dsc2Δ, dsc3Δ, dsc4Δ, sre1Δ and sre2Δ are shown and relevant genes are indicated. See also Figures S2 and S3.

