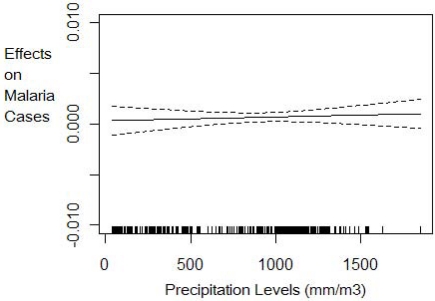
Figure 3.
Effect of precipitation levels on per capita malaria cases conditional on climate variability with 95% confidence intervals. This graph is the plot of the precipitation function PRECIPit * θ2(STDPRECIPit) in Equation (8). It shows how temperature levels affect malaria prevalence given the current climate variability conditions measured as the standard deviation in precipitation.

