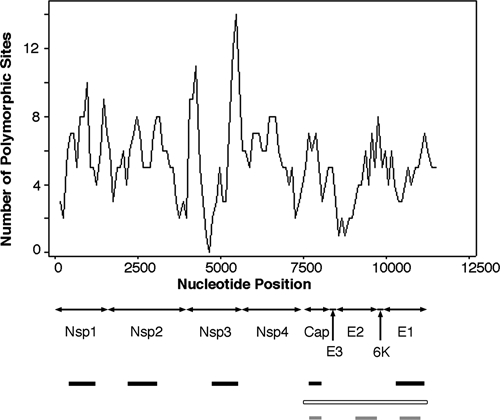
Figure 3.

Diversity levels among the six Florida isolates of eastern equine encephalitis virus initially analyzed. Sequence data derived from the six isolates from Volusia County were analyzed for sequence polymorphisms as described in the text. Black bars indicate the polymorphic regions chosen for subsequent analysis in this study. Open bar indicates the entire structural region whose sequence was compared with the Genbank sequences from isolates listed in Table 2. Gray bars indicate partial regions of the structural polyprotein gene analyzed in previous studies of sequence diversity among northeastern isolates of eastern equine encephalitis virus.11
