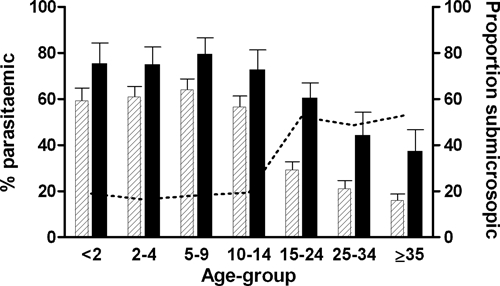
Figure 1.

Plasmodium falciparum parasite carriage by microscopy and polymerase chain reaction (PCR). The prevalence of P. falciparum infection by microscopy (dashed bars) and PCR (black bars) is given for individuals < 2 years (microscopy, N = 87/PCR, N = 24), 2–4 years (N = 122/N = 34), 5–9 years (N = 111/N = 33), 10–14 years (N = 108/N = 28), 15–24 years (N = 155/N = 61), 25–34 years (N = 124/N = 29), and ≥ 35 years (N = 144/N = 32). Error bars indicate the upper limit of the 95% confidence interval around the proportion. The dotted line indicates the proportion of infections that is below the microscopic threshold for detection.
