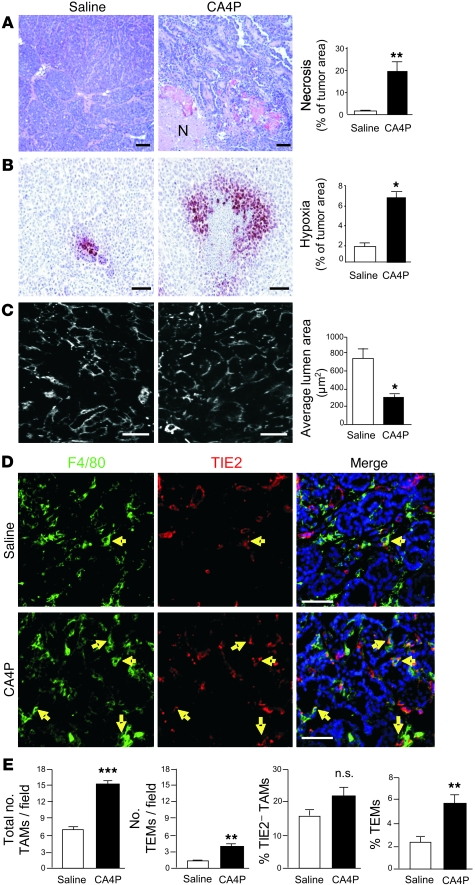
Figure 1. CA4P induced vascular damage, increased tumor hypoxia, and increased TEM numbers in MMTV-PyMT mammary tumors.
(A) H&E staining shows a marked increase in tumor necrosis (N) 24 hours after 50 mg/kg CA4P. (B) Staining with anti-PIMO shows increased hypoxia (red). (C) Tumor sections stained with anti-CD31 antibodies show reduced lumen of blood vessels (white) 24 hours after 50 mg/kg CA4P. (D) Tumors stained with DAPI (to show cell nuclei; blue), anti-F4/80 (green), and anti-TIE2 (red). Yellow arrows denote F4/80+TIE2+ TEMs; F4/80–TIE2+ structures represent blood vessels. (E) Number of all F4/80+ cells/field and F4/80+TIE2+ TEMs/field (by immunofluorescent staining; see D above) and proportion (%) of F4/80+TIE2– and F4/80+TIE2+ cells (TEMs) in viable cells obtained from dispersed tumors (by flow cytometric analysis; see Supplemental Figure 1). Scale bars: 50 μm. *P < 0.05, **P < 0.01, ***P < 0.001, compared with relevant control group. NS, no statistical difference (P > 0.05).

