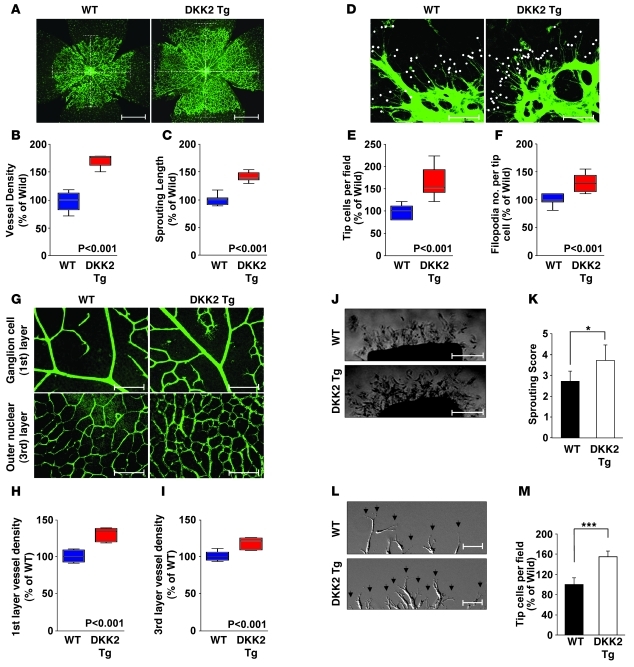
Figure 3. DKK2 Tg mice exhibit increased vessel formation in the retina.
(A–F) Isolectin B4 staining of whole-mounted P4 retinas of WT or DKK2 Tg mice (A and D). White broken lines indicate the range of vessel extension (A). Scale bars: 500 μm. White dots indicate filopodia extended from tip cells (D). Scale bars: 100 μm. Quantification of vessel densities (B), sprouting length (C), tip cell number (E), and filopodia (F). (G–I) Isolectin B4 staining of whole-mounted P12 retinas (G). Scale bars: 100 μm. Quantification of vessel density in the ganglion (first) (H) and the outer nuclear (third) cell layer (I). (J–M) Aortic segments were harvested from WT and DKK2 Tg mice (n = 7 per group). (J) Endothelial sprouts forming branching cords from the margins of aortic segments were photographed with a phase microscope. Scale bars: 200 μm. (L) Dynamic movement of endothelial sprouts from the margins of aortic segments was captured as real-time video (see Supplemental Video 1). Scale bars: 40 μm. Arrows indicate filopodia. Sprouting scores (K) and quantification of tip cell numbers (M). Sprouting scores were scored from 0 (least positive) to 5 (most positive). Data represent mean ± SD. *P < 0.05; ***P < 0.001. Box indicates 25%~75% value and whisker indicates media value in box plot (B, C, E, F, H, and I).

