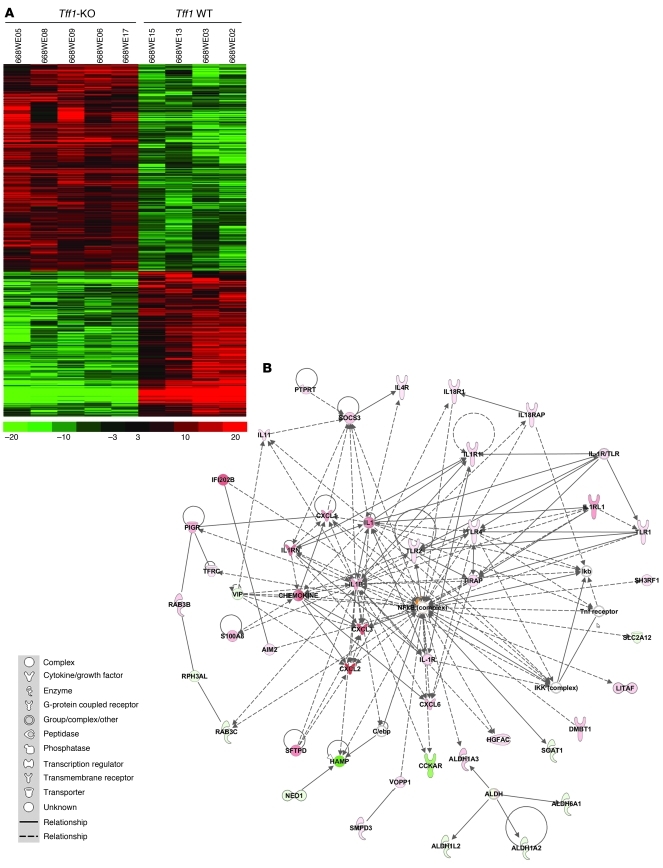
Figure 2. Molecular signatures in the Tff1-knockout gastric tissues.
(A) Heat map showing the hierarchical clustering of 636 genes that had significant changes (≥2.8-fold; P ≤ 0.05). Red and green indicate relative upregulation or downregulation of genes, respectively. (B) Network analysis predicted by Ingenuity Pathway Analysis in Tff1-knockout mice. As shown, the analysis of the 636 differentially expressed genes indicated a central role for the NF-κB network in the Tff1-knockout gastric tissues as compared with wild-type tissues. Several inflammatory genes with differentially regulated mRNA expression levels are shown.

