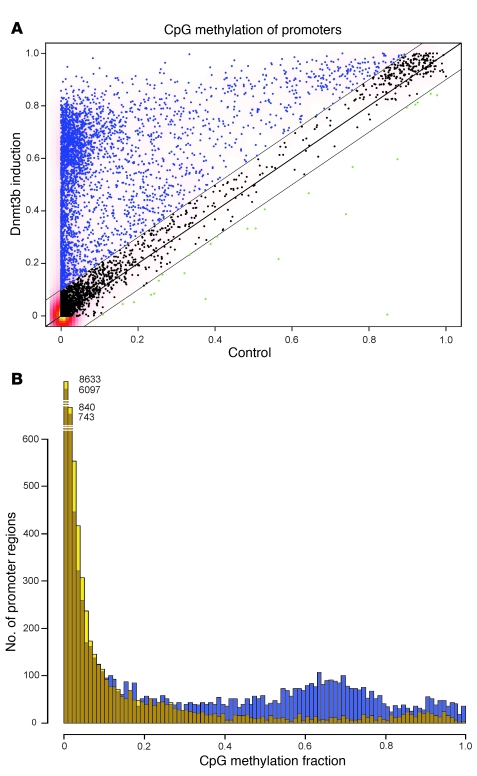
Figure 2. RRBS analysis of colon epithelial cells with or without Dnmt3b transgene expression in vivo.
RRBS data from colon epithelial cells with or without Dnmt3b transgene expression (n = 3 each) were used to calculate de novo methylation in 13,361 annotated promoter regions. (A) Scatter plot demonstrating Dnmt3b-mediated hypermethylation of a distinct subpopulation of promoter regions (11.7% of promoters showed >0.5 methylation gain in Dnmt3b-expressing tissue; lines parallel to the diagonal indicate the position of 0.1 methylation gain or loss). (B) Histogram further illustrating the appearance of a discrete subpopulation of hypermethylated promoters in Dnmt3b-expressing samples (blue), whereas the control samples (brown) contained few promoter regions with methylation scores >0.5.

