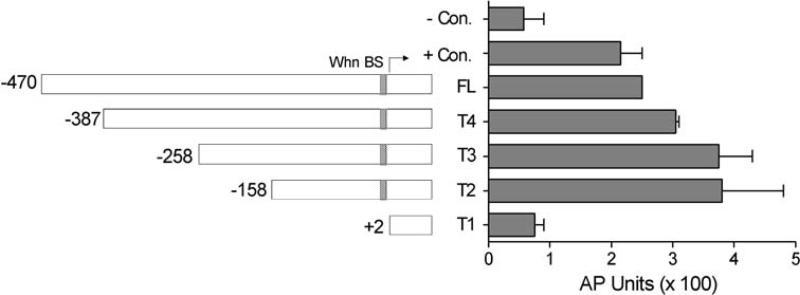
Fig. 3.
Truncation analysis of the SUMO1 promoter region. The full-length SUMO1 promoter (the pSEAP-S1Promoter construct designated FL in the figure) and truncated constructs (T4–T1) are diagramed with the position of the 5′ end of each fragment indicated relative to the transcription start site (marked with arrow). The position of the predicted Whn binding site is also indicated. The measured activity of each truncation is shown in the graph. Each construct was transfected into HaCaT cells and supernatants were collected at 48 h post-transfection for analysis of AP activity. Values are reported as actual AP units without normalization and are the average of two independent experiments (error bars for the FL sample are too small to be visible in this figure). The negative (−) control was the pSEAP-BASIC vector and the positive (+) control was the pSEAP-CONTROL vector. The values for the T4, T3, and T2 samples were not significantly different from the FL sample (P > 0.05) while the reduction in the T1 sample was statistically significant (P < 0.05)

