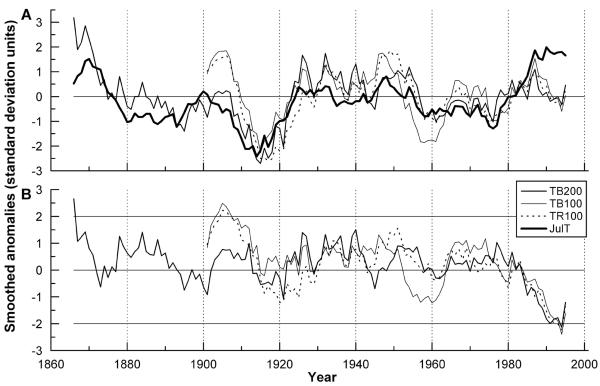
Fig. 6.
A Smoothed residual chronologies and mean July temperature for the period 1866-1999 (TB200) and 1901-1999 (TB100, TR100), respectively. Curves represent z-transformed 11-yr running averages with equal weights (see Material and Methods). B Difference series (growth minus mean July temperature).

