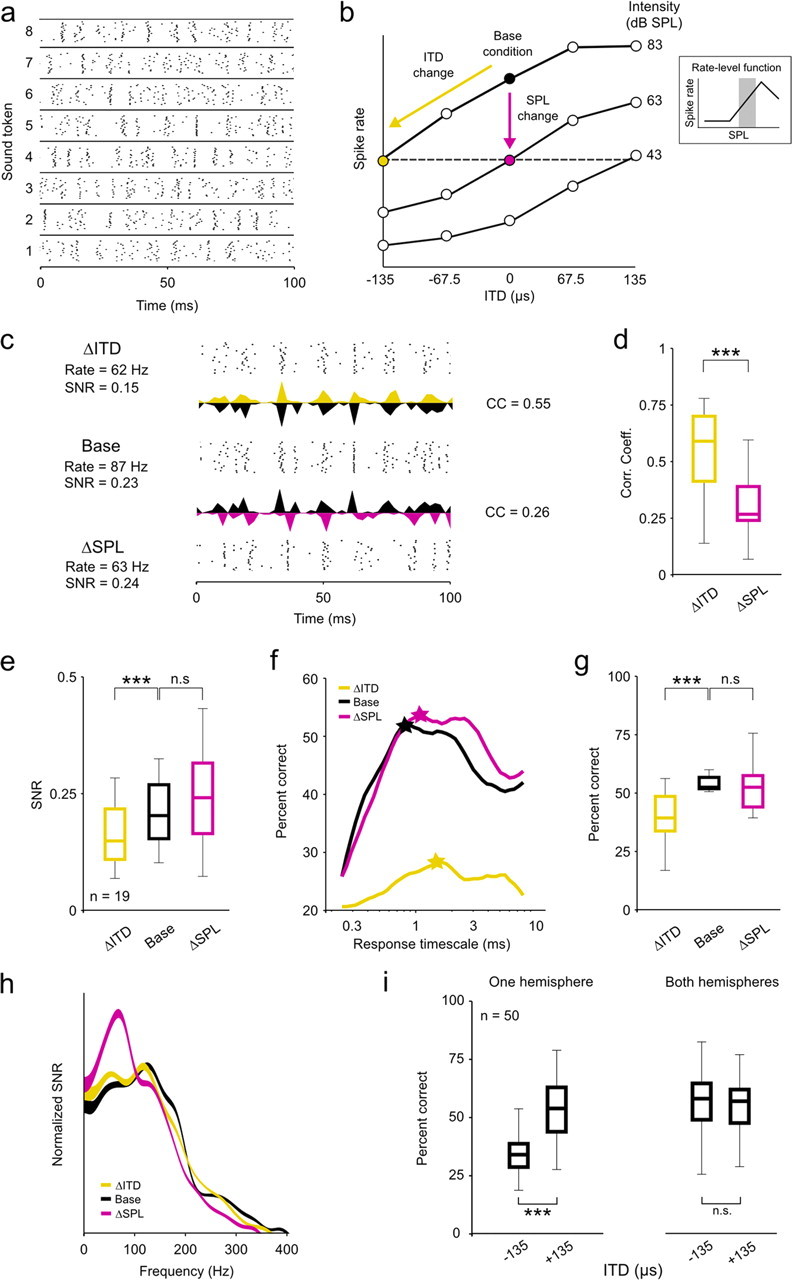
Figure 1.

Changes in ITD and intensity have different effects on the coding of low-frequency sounds. a, A raster plot showing the spike trains recorded from a typical neuron in response to 20 repeated presentations of eight different sound tokens presented at 63 dB SPL with 0 μs ITD. b, A schematic diagram depicting the relationship between the three stimulus conditions: the base condition, the ITD change (ΔITD; a decrease in ITD) condition, and the intensity change (ΔSPL; a decrease in intensity) condition. Only those cells for which the ΔSPL condition could be defined by a change in intensity along the positive slope of the RLF were analyzed. c, Raster plots and PSTHs showing the responses of a typical neuron to the same sound token for the three conditions. The mean overall spike rates and response SNRs are shown for each condition, and the CCs between the PSTHs for the base condition and each of the two change conditions are shown. Different PSTHs extend upward and downward from the same axis for ease of visual comparison. d, Box plots showing the distribution of CCs between the PSTHs for the base condition and each of the two change conditions for a sample of 19 neurons. In each plot, the central mark indicates the median, the edges of the box indicate the 25th and 75th percentiles, and the error bars extend to the most extreme values. The results of paired Wilcoxon tests comparing the medians of the distributions are indicated. e, Box plots showing the distribution of response SNRs for each of the three stimulus conditions, presented as in d. f, Decoder performance as a function of response timescale for a typical neuron under the three stimulus conditions. The stars indicate the timescale corresponding to the best performance. g, Box plots showing the distribution of decoder performance at the optimal timescale for each of the three stimulus conditions, presented as in d. Chance level performance was 12.5%. h, The SNR as a function of response frequency under the three stimulus conditions, averaged across all cells in the sample and normalized such that the area under each curve is the same. The thickness of the lines indicates the SEM. i, Box plots showing the distribution of decoder performance for 50 randomly chosen populations of 10 cells with either all cells from the same hemisphere or half of the cells from each hemisphere, presented as in d. Only the distributions for responses to sounds at 83 dB SPL are shown, but the distributions for other intensities were similar. All neurons were in fact recorded in the same hemisphere, but responses to sounds at −135 and +135 μs ITD were switched for half of the neurons to simulate responses from both hemispheres. n.s., Not significant. ***p < 0.001.
