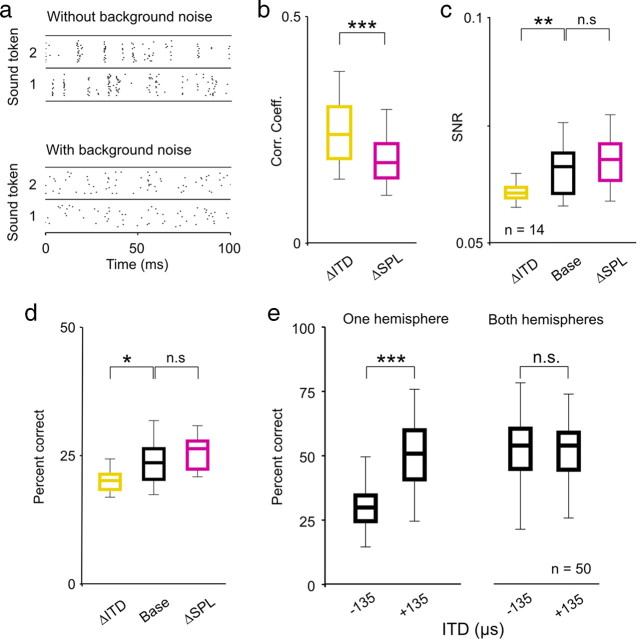
Figure 2.
The effects of ITD and intensity on the coding of low-frequency sounds are similar with and without background noise. a, A raster plot showing the spike trains recorded from a typical neuron in response to 20 repeated presentations of one sound token presented at 63 dB SPL with 0 μs ITD with and without background noise at a signal-to-noise ratio of 0 dB. b–e, Distributions of response CCs, SNRs, and decoder performance for a sample of 14 single neurons, and decoder performance for randomly chosen populations with either all cells from the same hemisphere or half of the cells from each hemisphere, presented as in Figure 1. n.s., Not significant. *p < 0.05, **p < 0.01, ***p < 0.001.

