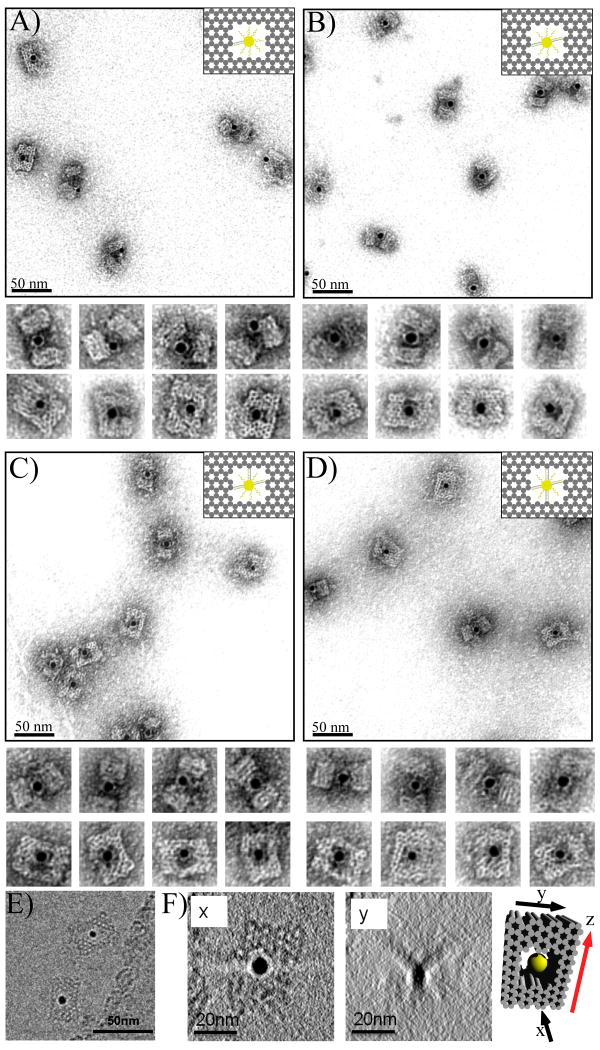
Figure 2.
(A-D) TEM images of DNA cages with 5 nm AuNPs inside, encapsulated using different numbers of capture strands. (A) one; (B) two; (C) three; and (D) four capture strands. The samples were negatively stained with uranyl formate to improve the imaging contrast. (E) A typical cryo-EM image without negative stain showing the DNA cage with a 5 nm AuNP encapsulated inside. (F) The Z projections of the complete reconstructed cryo-EM tomogram from two different views. Planes x and y correspond to the black arrows shown on the model to the right; x corresponds to the top view easily seen in the un-tilted micrograph, while y is the face coming into view as the sample is tilted. The bold red arrow shown on the model indicates the rotation axis.

