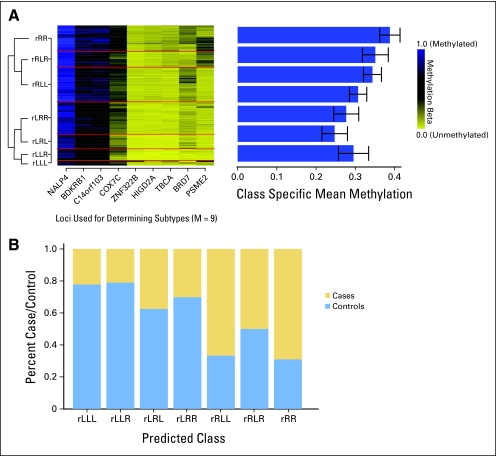
Fig 2.
DNA methylation profiles defined by a panel of nine loci are significantly associated with bladder cancer. (A) The recursively partitioned mixture model–based classification of methylation of nine loci (columns) in the peripheral blood–derived DNA of the 230 participants (rows) in the testing data set is depicted in the heat map, with the seven classes separated by red lines. The overall mean methylation and CIs (error bars) by class are depicted in the bar graph on the right. (B) The prevalence of cases and controls (y-axis) in each of the predicted classes (x-axis). A permutation-based χ2 test suggests that case-control prevalence is significantly different by methylation class (P < .0001).

