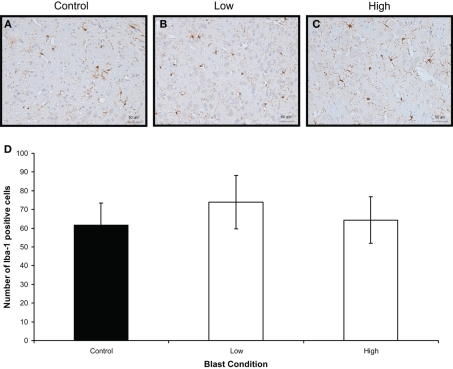
Figure 6.
Iba-1 immunostaining (brown) of (A) control (B) low, and (C) high, blast exposure 1 day after blast. Scale bar = 50 μm. (D) Mean number of Iba-1 positive cells per field view in the corpus callosum of control, low (p = 0.26 vs. control), and high (p = 0.019 vs. control) blast-exposed animals 1 day after blast at × 20 magnification. No difference in Iba-1 positive cells was found between blast exposure groups (low and high) and control. *p < 0.05.

