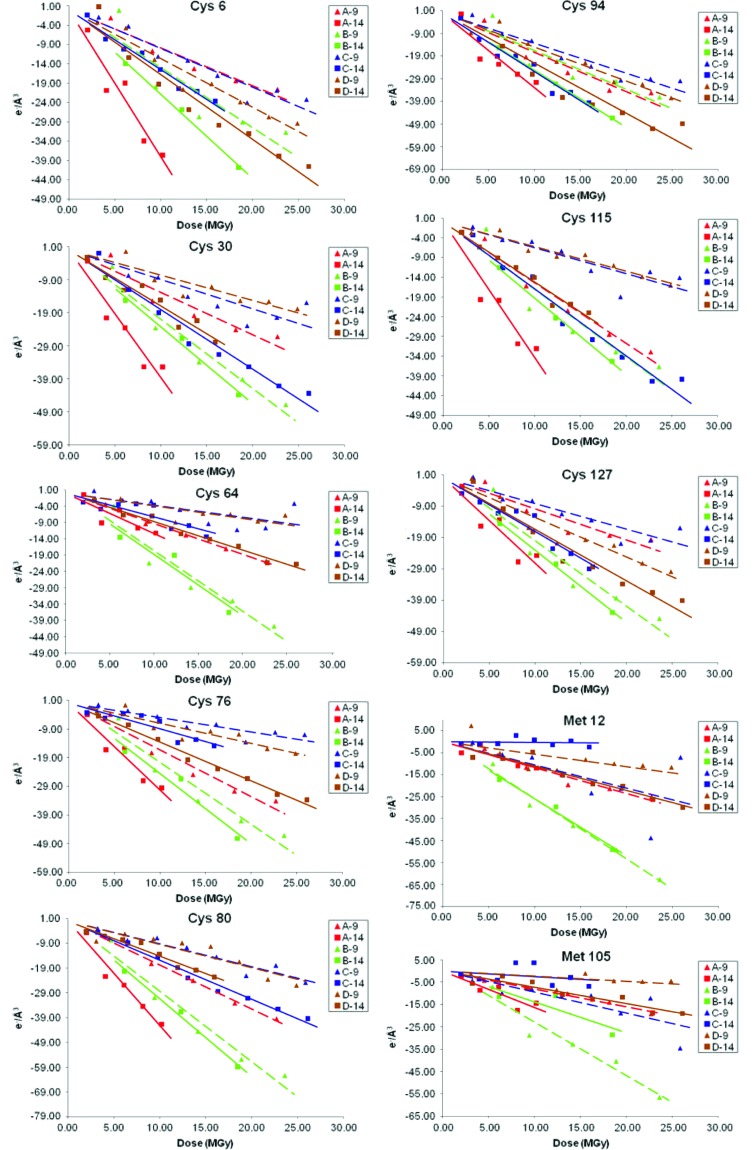
Figure 1.
Integrated intensity (electrons per cubic Å) for each sulfur site as a function of dose absorbed by the crystal. The data points shown as triangles and squares correspond to the crystals exposed at 9 keV and 14 keV, respectively; the discontinuous lines and solid lines were fitted to the 9 keV and 14 keV data, respectively. Each crystal pair used for the comparison is shown in the same color. All the data have been normalized so that the integrated intensity is zero at zero dose.

