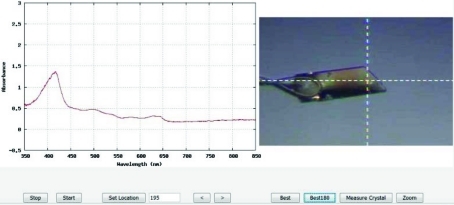
Figure 3.
A snapshot of the JAVA interactive window for real-time analysis of single-crystal electronic absorption spectroscopy at beamline X26-C. The buttons along the bottom control the playback of the animation as well as display the C3D analysis of the ‘Best’ and ‘Best180’ images and spectra from the crystal. In this particular case the Best180 image and spectra yield a goniometer setting of 195°. The Measure Crystal tab on the lower right provides the ability to quickly estimate the crystal dimensions.

