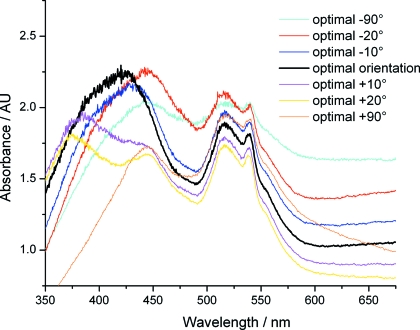
Figure 2.
Horse heart cytochrome c single-crystal spectra showing variations in both absorption peaks and baseline as a function of crystal orientation. The optimal orientation is obtained when the loop face is almost perpendicular to the UV-Vis light path and a facet of the crystal is in the same plane. Spectra are the average of ten 20 ms exposures and were collected using a 4DX single-crystal spectrometer (4DX Systems), illuminated by a balanced deuterium/halogen light source (Ocean Optics), attached to a Shamrock 163 spectrograph and Newton CCD detector (Andor Technology). For crystallization conditions, see §3.1.

