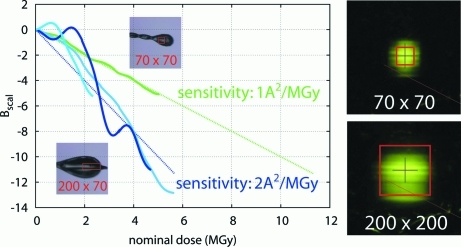
Figure 4.
The importance of accurate characterization of beam dimensions. The decay rates of two datasets measured during the visit (green: 3AAA; blue: 1AAA) have been combined from Fig. 1 ▶ (column 4) for comparison. Both datasets were measured without filters but with different beam sizes (red boxes on inset crystal images). The dotted lines show the nominal sensitivities calculated assuming the same flux density for both beam settings (§2.3); it is, however, more likely that altered slit settings reduced the beam flux density in the box by a factor of two, a change not apparent in the beam images. Beam size labels are as in Fig. 1 ▶.

