Figure 2.
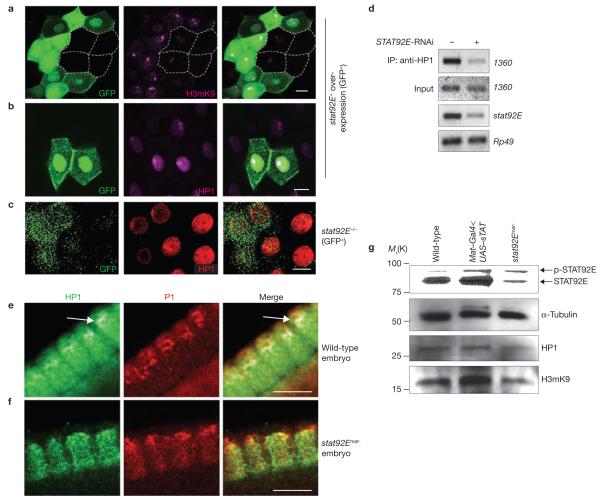
STAT92E levels control heterochromatin abundance and HP1 localization. (a, b) Third-instar salivary glands overexpressing stat92E+ in random cells marked with GFP (green) and stained with anti-H3mK9 (magenta in a) or anti-HP1 (magenta in b) are shown partially. Note the increased levels of H3mK9 or HP1 in GFP+ cells, compared with GFP− cells (four GFP− cells are outlined). (c) A third-instar salivary gland containing stat92E−/− cells marked with GFP (green) and stained with anti-HP1 (red) is shown partially. Note the lack of HP1 foci in the GFP+ cells. (d) Enrichment of HP1 on heterochromatin was detected by ChIP using an anti-HP1 antibody and PCR primers that amplify the 1360 transposon element (heterochromatin). Note the marked reduction in HP1 association with 1360 sequences in the STAT92E RNAi-depleted sample (lane 2), compared with the control (lane 1). (e, f) Cellular blastoderm-stage embryos stained with anti-HP1 (green) and propidium iodide (PI; red) to show DNA. Part of the cortical cell layer is shown. Note the concentrated HP1-staining at the apical region of the wild-type embryo (arrow in e), which is absent in the stat92Emat− embryo (f). (g) Total protein extracts from 0–12 hold embryos of wild-type (lane 1), Nanos–Gal4 × UAS–stat92E+ (lane 2) and stat92Emat− females (lane 3) were subjected to SDS–PAGE and blotted sequentially with anti-STAT92E and anti-α-tubulin antibodies (for full-length gel, see Supplementary Information, Fig. S7), or with anti-H3mK9 and anti-HP1 antibodies, respectively. The membrane was stripped between blots. Note the correlation between H3mK9 and STAT92E levels. Scale bars, 10 μm.

