Figure 2. Complete PET response after two cycles of gemcitabine and vinorelbine.
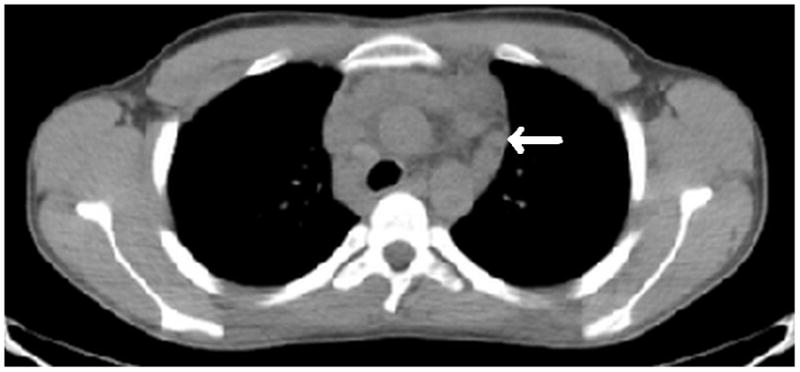
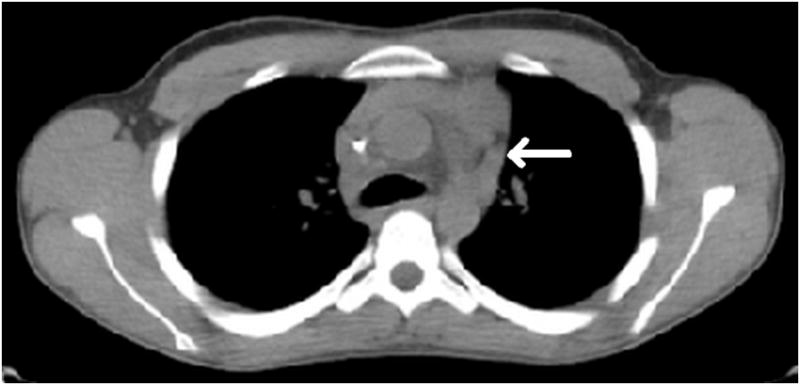
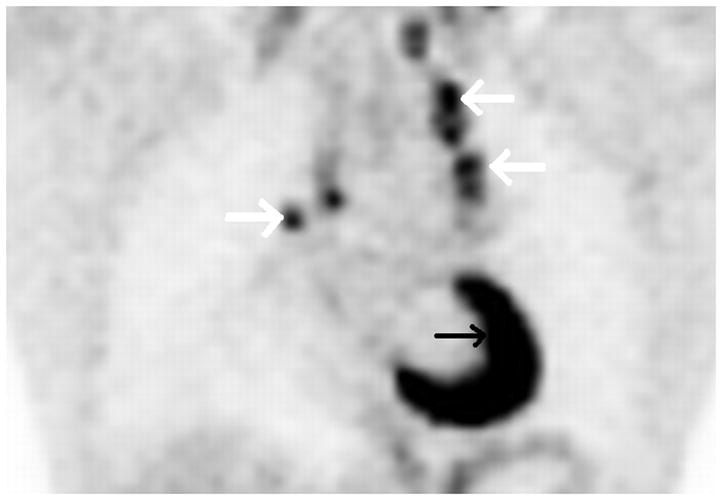
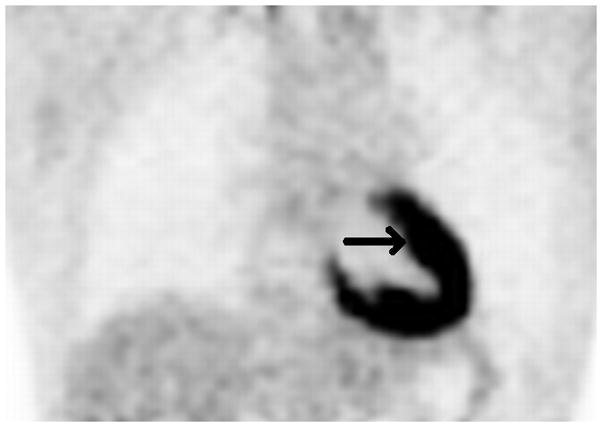
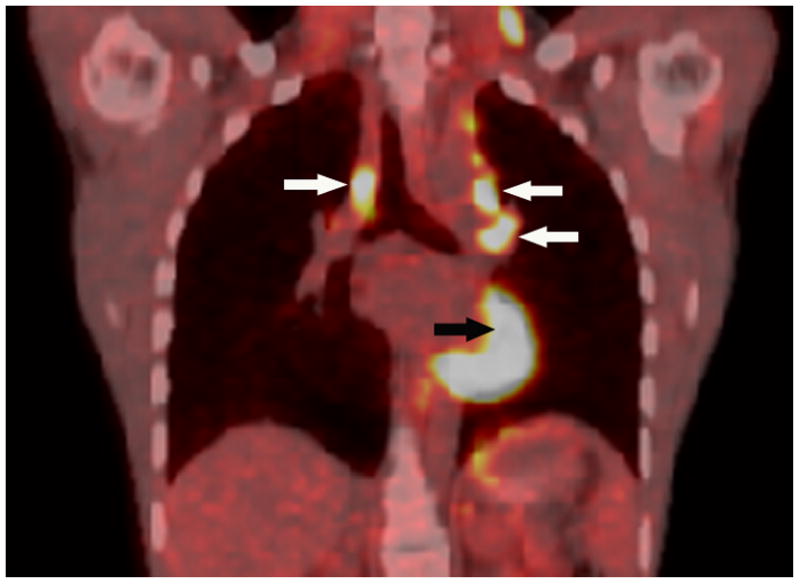
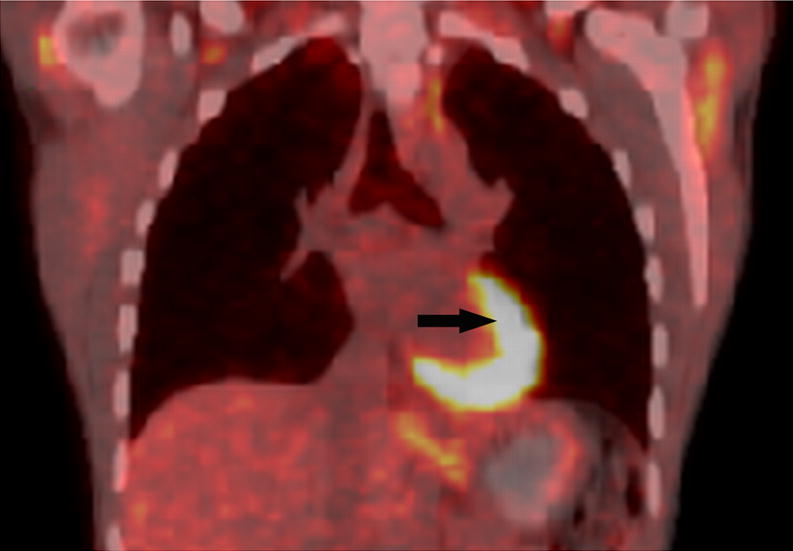
Axial low dose non contrast CT images of the mediastinum obtained as part of the PET scan for attenuation correction show very little change in size of the left superior mediastinal adenopathy (white arrows) from the pre-treatment (Fig. 2A) to post-treatment (Fig. 2B) scans. PET activity is seen to resolve in bilateral superior mediastial adenopathy (white arrows) between pre (Fig, 2C) and post (Fig. 2D) treatment coronal Maximum Intensity Projection (MIP) images. This change is confirmed on the corresponding pre- and post-treatment fused coronal PET/CT images (Figs. 2E and 2F, respectively). Normal cardiac PET activity is denoted by black arrows on both MIP and fused sequences. These representative images are from patient #1 in Table 1.
