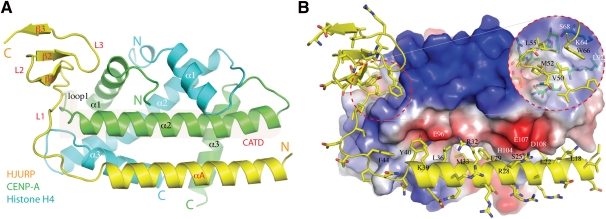
Figure 1.
Overall structure. (A) A ribbon diagram of the complex structure. CENP-A is shown in green, histone H4 is shown in cyan, and HJURP is shown in yellow. Secondary structure elements in CENP-A, H4, and HJURP are labeled in black, white, and red letters, respectively. The shaded area indicates the CATD of CENP-A. (B) Overview of interactions between HJURP and the CENP-A–H4 heterodimer. The structure is viewed from the same direction as in A, and the heterodimer is shown in a surface representation with electrostatic potential distribution; white, blue, and red regions indicate neutral areas, positively charged areas, and negatively charged areas, respectively. The side chains of HJURP are shown in a stick model (carbon, yellow; nitrogen, blue; oxygen, red; sulfur, gold) superimposed on the ribbon representation of the main chain. An inset enclosed in the red dashed circle on the right indicates an orthogonal view of an interaction region (enclosed in the left circle) involving amino acids in the L1 and β-sheet domain. CENP-A residues involved in the interactions in this region are also shown in a stick model. (Green) Carbon. White and black letters label selected CENP-A and HJURP residues, respectively.

