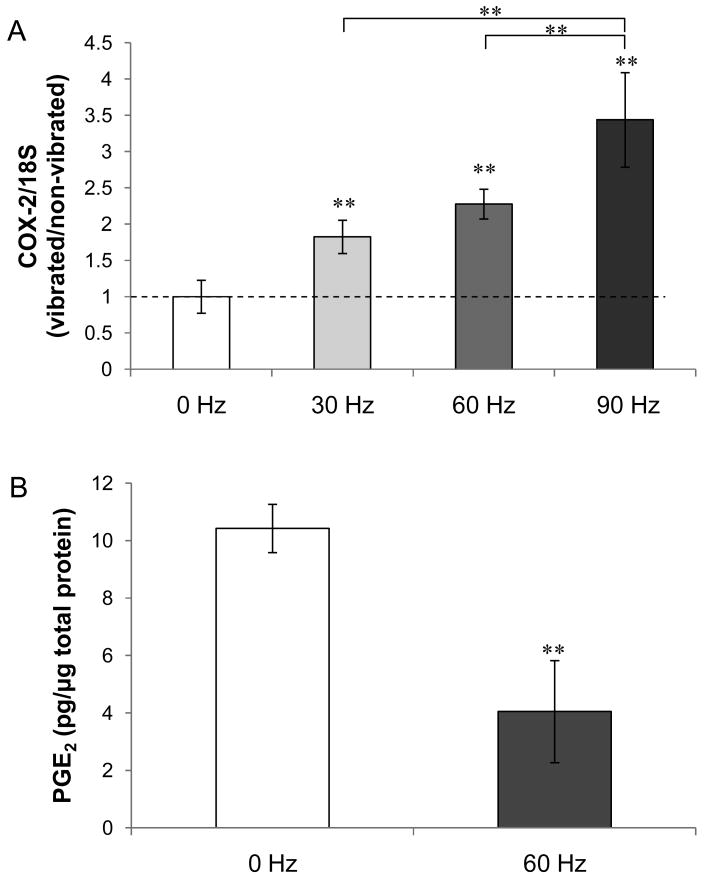
Figure 2. Effect of LMHF vibration on COX-2 mRNA level and PGE2 release in MLO-Y4 cells.
(A) The ratio of normalized COX-2 mRNA level between vibrated group and non-vibrated control (0 Hz) increased as the frequency of vibration increased, with the highest fold increase seen in 90 Hz (3.4-fold). (B) A 61% decrease in the amount of PGE2 accumulated in the medium during 1 hour of vibration loading was observed. **p<0.01 compared to 0 Hz control unless otherwise indicated (n=5).

