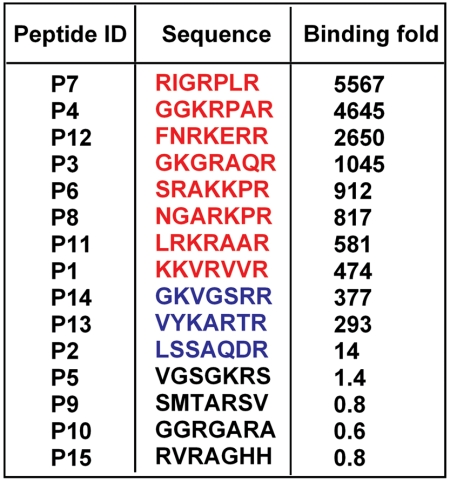
Fig. 6.
Peptide sequence displayed by selected phage clones and their relative ratio of binding to PPC-1 cells (expressing NRP-1) compared to M21 cells (negative control). (A) The clones with high-affinity (R/K)XXR motifs are displayed in red, clones with XXXR motifs are shown in blue, and non-CendR sequences are in black.

