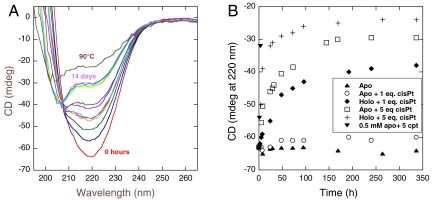
Fig. 2.
(A) Far-UV CD spectra as a function of time (0 h to 14 d) for apo-Atox1 (50 μM) mixed with 5 eq cisPt and incubated at 20 °C. Time points are 0, 5, 8, 24, 29, 32, 48, 73, 144, 168, 240, and 336 h. (B) CD changes at 220 nm (at 20 °C) plotted as a function of time for apo-Atox1 alone, apo-Atox1 (50 μM) mixed with 1 or 5 eq cisPt, and for Cu-Atox1 (50 μM) mixed with 1 or 5 eq cisPt. Also shown are a few time points for 0.5 mM apo-Atox1 mixed with 5 eq cisPt.

