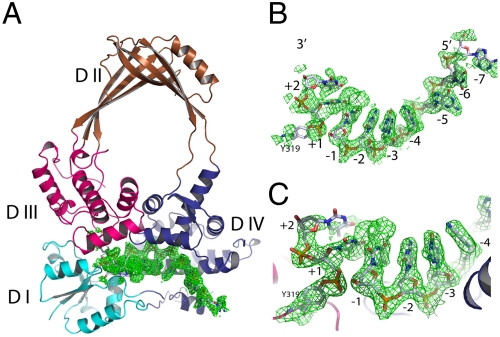
Fig. 1.
Structure of the topoisomerase I and DNA covalent complex. (A) Ribbon representation of the overall structure with four domains shown in different colors. The bound DNA fragments are shown with electron density map (green, 2fo-fc map at 1.5σ cutoff). (B) Annealed difference map (fo-fc, 1.5σ cutoff) around the DNA fragments. The difference map was calculated in the absence of bound DNA. (C) Closer view of the active site of the covalent intermediate. The continuous density (final 2fo-fc map) from Y319 to the 3′ dinucleotide (TT) is shown at 1.0σ cutoff. A clear density break of scissile bond is shown.

