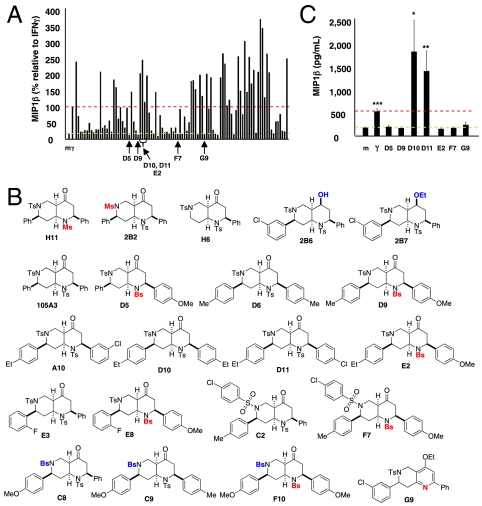
Fig. 2.
EC-activating effects of 96 naphthyridinones. (A) Data represent percent induction relative to IFNγ for each of the 96 analogs analyzed over two experiments. (B) Structures of selected active (H6, 2B6, 2B7, 105A3, D6, A10, D10, D11, E3, C2, C8, and C9) and inactive octahydro-1,6-naphthyridin-4-one analogs (H11, 2B2, D5, D9, E2, E8, F7, F10, and G9). (C) Validation of seven (active and inactive) analogs. Data represent the mean ± SEM from two independent experiments performed in triplicate wells (n = 6 wells per condition), * p value < 0.05, ** p value < 0.03, *** p value < 0.003.

