Fig. 2.
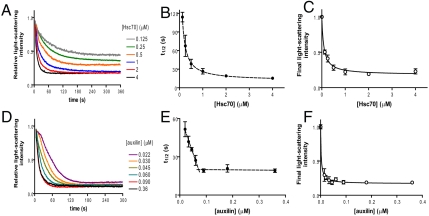
The effect of [Hsc70] or [auxilin] on clathrin cage disassembly. (A) Representative light-scattering curves containing clathrin cages (0.09 μM triskelia), auxilin (0.3 μM), and ATP (500 μM) with disassembly initiated by various concentrations of Hsc70 (0.15–4 μM). (D) Representative disassembly curves with clathrin cages (0.09 μM triskelia) premixed with varying [auxilin] (0.022–0.36 μM) and 500 μM ATP, and initiated by addition of 2 μM Hsc70. (B and E) Symbol t1/2 on the vertical axis denotes the average time taken for disassembly of 50% of clathrin cages obtained from raw data traces as in A and D, respectively. Data points and error bars, respectively, are mean ± standard error from replicated measurements (n≥4). (C and F) Average amplitude (total amount of disassembly) at the end of each assay from curves obtained as in A and D, respectively. Data points and error bars, respectively, are mean ± standard error from replicated measurements (n≥4). The smooth curves in panels B, C, and F represent a fit to the hyperbolic saturation function (Eq. S1), which serves as an empirical description of the data.

