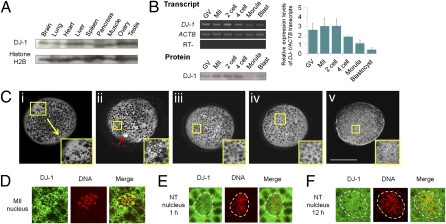
Fig. 2.
DJ-1 expression in porcine tissues, oocytes, and nuclear transfer embryos. (A) DJ-1 proteins exist in various types of tissues examined by Western blotting. (B) Expression of DJ-1 transcripts and proteins was examined in oocytes (GV and MII stages) and NT embryos during preimplantation development. The graph shows the relative expression levels of DJ-1 transcripts examined by semiquantitative RT-PCR (normalized by ACTB transcripts). The numbers of oocytes and embryos used for Western blotting are as follows: GV, eight; MII, eight; two-cell, eight; four-cell, seven; Morula, two; Blast, three. Error bars, mean ± SEM. (C) Localization of DJ-1 protein in oocytes and NT embryos, observed by immunofluorescence analysis. i–v, a whole oocyte or a NT embryo, with an enlargement of the yellow boxed area (Inset) shown at the Lower Right. The enlarged areas (Insets) contain nuclei of oocytes or NT embryos. White areas show staining with anti–DJ1 antibody. i, GV oocyte; ii, MII oocyte; iii, NT embryo 1 h after nuclear transfer; iv, NT embryo 3 h after transfer; v, NT embryo 12 h after transfer. A red arrow in ii represents a first polar body in a MII oocyte. (Scale bar: 100 μm.) (D) Distribution of DJ-1 in a MII nucleus at high magnification. Yellow color on merged photos (Merge) represents nuclear localization of DJ-1. (E) DJ-1 distribution in transferred fibroblast nuclei 1 h after nuclear transfer into a MII oocyte. The border between nucleus and oocyte cytoplasm is marked with dashed white lines. (F) DJ-1 in transferred fibroblast nuclei 12 h after nuclear transfer.

