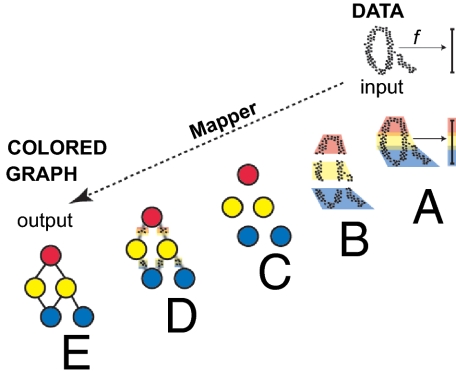
Fig. 1.
Mapper starts with a set of data points and a filter function f and produces a colored graph that captures the shape of the data. (A) The image of the function f is subdivided into overlapping intervals. (B) Each piece is clustered separately. (C) Each cluster is represented by a colored disk: a bin of points. The color of each bin corresponds to the average value of the filter function f on the data points inside the bin. (D) Identify pairs of bins that have points in common and (E) connect pairs of bins that have points in common by an edge.

