Fig. 3.
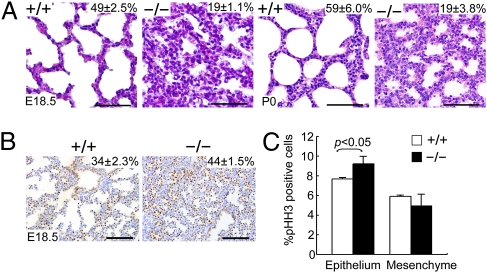
Abnormal lung morphogenesis and lung epithelial cell hyperplasia in Fstl1−/− mice. (A) Histological analysis of embryos (E18.5) and newborn pups (P0) revealed normal inflated alveoli with thinner septa in WT, but thickened hypercellular septa with reduced airspaces in Fstl1−/−. (Scale bars, 50 μm.) (B) Distribution of TTF1 by IHC. (Scale bars, 100 μm.) The percentage of the total examined sac area of the lung section or the percentage of the TTF1-positive cells in the total cells of the lung are shown in the top right corner of each diagram (P < 0.05). (C) Quantification of cell proliferation by p-HH3 immunostaining in E15.5 WT and Fstl1−/− lungs. The graph represents the mean of four independent experiments showing the comparison of the percentages of p-HH3–positive cells in the epithelium and mesenchyme between WT and Fstl1−/− lungs.

