
Fig. 1.
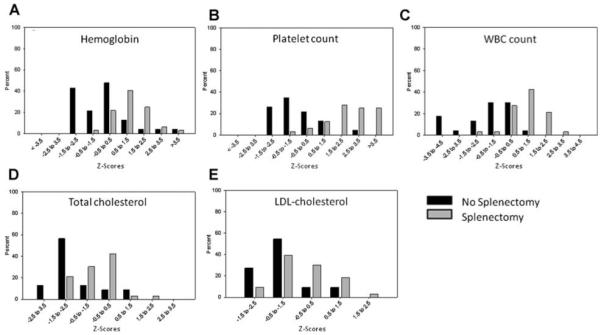
Percentage of patients whose values fall in each category for z-scores, demonstrating the distribution around the mean (z-score equal to 0). Variables shown are hemoglobin concentration (A), platelet count (B), white blood cell count (C), total cholesterol (D), and LDL-C (E) in the two groups: No splenectomy (black shading) and splenectomy (gray shading).