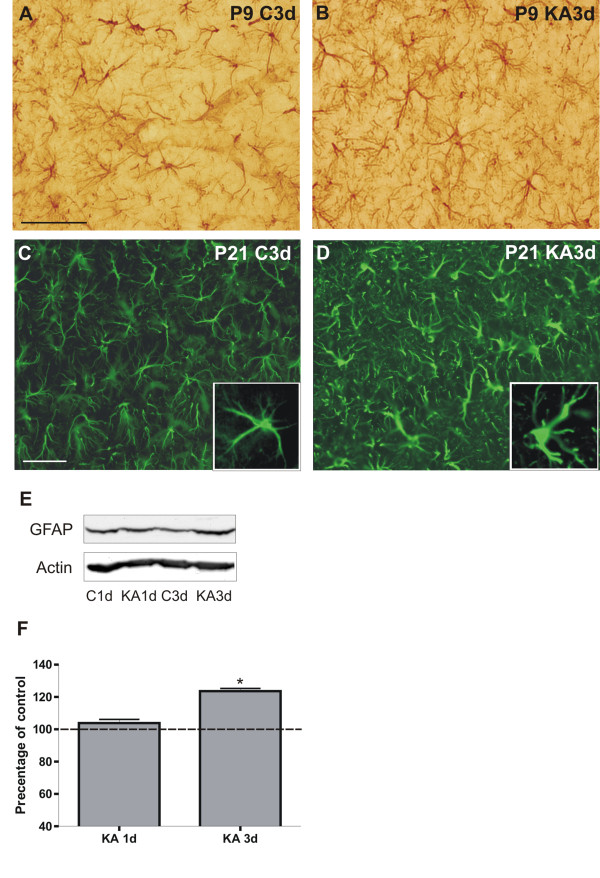
Figure 3.
Astrocyte morphology in immature and juvenile hippocampus 3 d after SE. Representative images of GFAP immunostainings in the CA1 region of hippocampus for a P9 (A) and a P21 (C) control rat, and a KA-treated P9 (B) and P21 (D) rat 3 d after SE. The box in C and D shows a GFAP-positive cell at higher magnification. Note the prominent morphological changes in astrocytes with thickened, heavily GFAP-positive processes in the KA-treated P21 rat, and the lack of any changes in the P9 rats. A representative western blot (E) and its semi-quantitative analysis (F) of GFAP expression in P21 rat hippocampus in age-matched controls and 1 and 3 d after KA-induced SE. *p < 0.05, compared to the age-matched control group (one-way ANOVA). Abbreviations: C, control; KA, KA-treated; P, postnatal. Scale bars: 50 μm in A, applicable also for B; 50 μm in C, applicable also for D.

