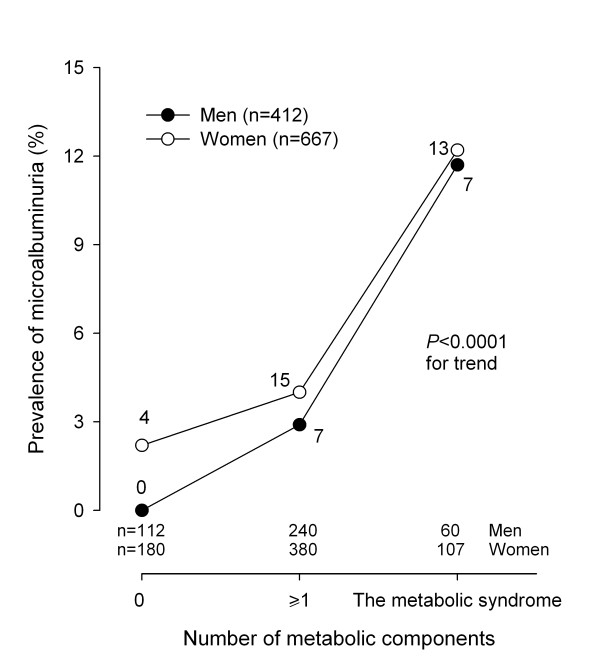
Figure 1.
The prevalence of microalbuminuria by number of the metabolic syndrome components subjects in men (closed circles) and women (open circles) separately. On the horizontal axis, 0 and ≥1 indicate subjects without any metabolic syndrome components and those with at least 1 component but not diagnosed as the metabolic syndrome, respectively. The number of subjects per subgroup is given at the bottom, and those with microalbuminuria alongside the symbols. P < 0.0001 for trend in men and women combined.

