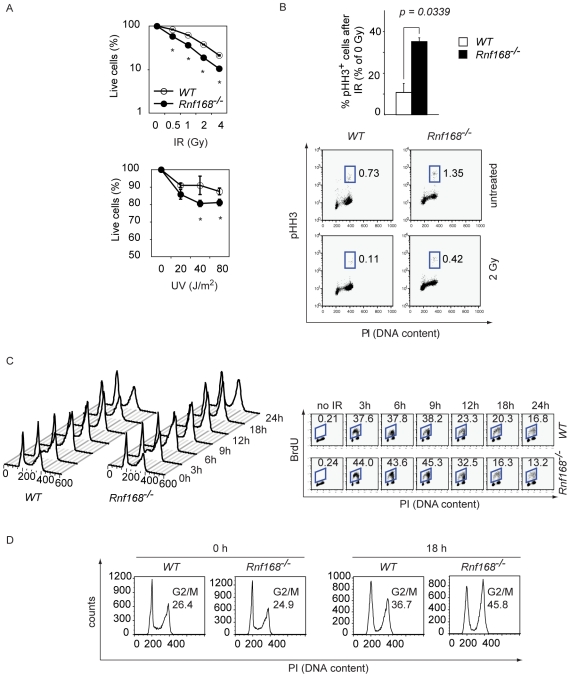
Figure 1. Impaired DNA damage response in Rnf168 deficient cells.
(A) Cells were subjected to IR or UV, and the extent of cell death was determined 24 hours later. Three independent experiments were performed. Data are presented as the mean ± SEM. *p<0.05. (B) Primary MEFs (passage 2) either untreated or irradiated (2 Gy) were stained with anti-phospho-histone H3 (pHH3) antibody and PI at 1 hour post IR. The percentage of mitotic cells was determined by FACS. Three independent experiments were performed. Data are presented as the mean ± SEM. *p<0.05. (C) Cell cycle progression post IR (10 Gy) treatment of WT and Rnf168−/− primary MEFs (Passage 2) was examined using BrdU/PI assay and FACS. Representative data are shown for three independent experiments. (D) Accumulation at the G2 phase of WT and Rnf168−/− primary MEFs (passage 2) post IR (10 Gy). Cell cycle profiles were examined by PI staining and representative data are shown from three independent experiments.

