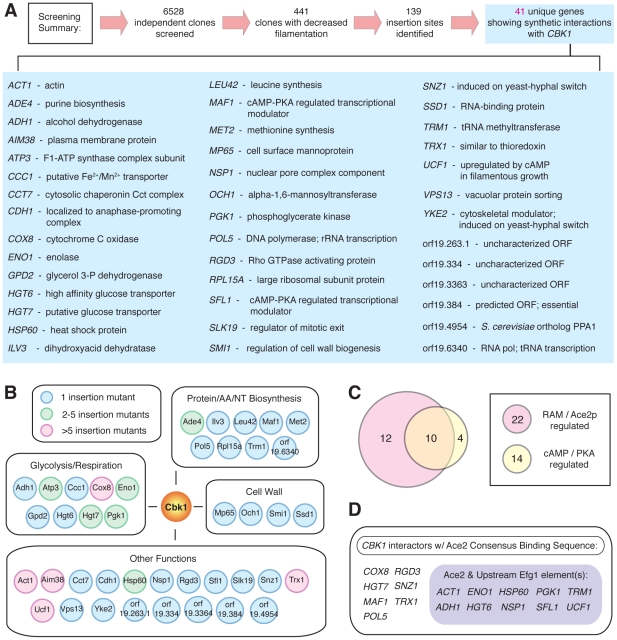
Figure 3. Summary and bioinformatic analysis of screening data.
(A) Summary of screening results and list of CBK1-interacting genes. (B) List of CBK1-synthetic genetic interactions during morphogenesis grouped according to three most common GO terms. Colors indicate the number of times each insertion was isolated. (C) Venn diagram depicting the number of genes putatively co-regulated by the RAM and PKA pathways. (D) List of CBK1-interacting genes with Ace2 and both Ace2/Efg1 consensus binding sites within the region 1000 bp upstream of the start codon.

