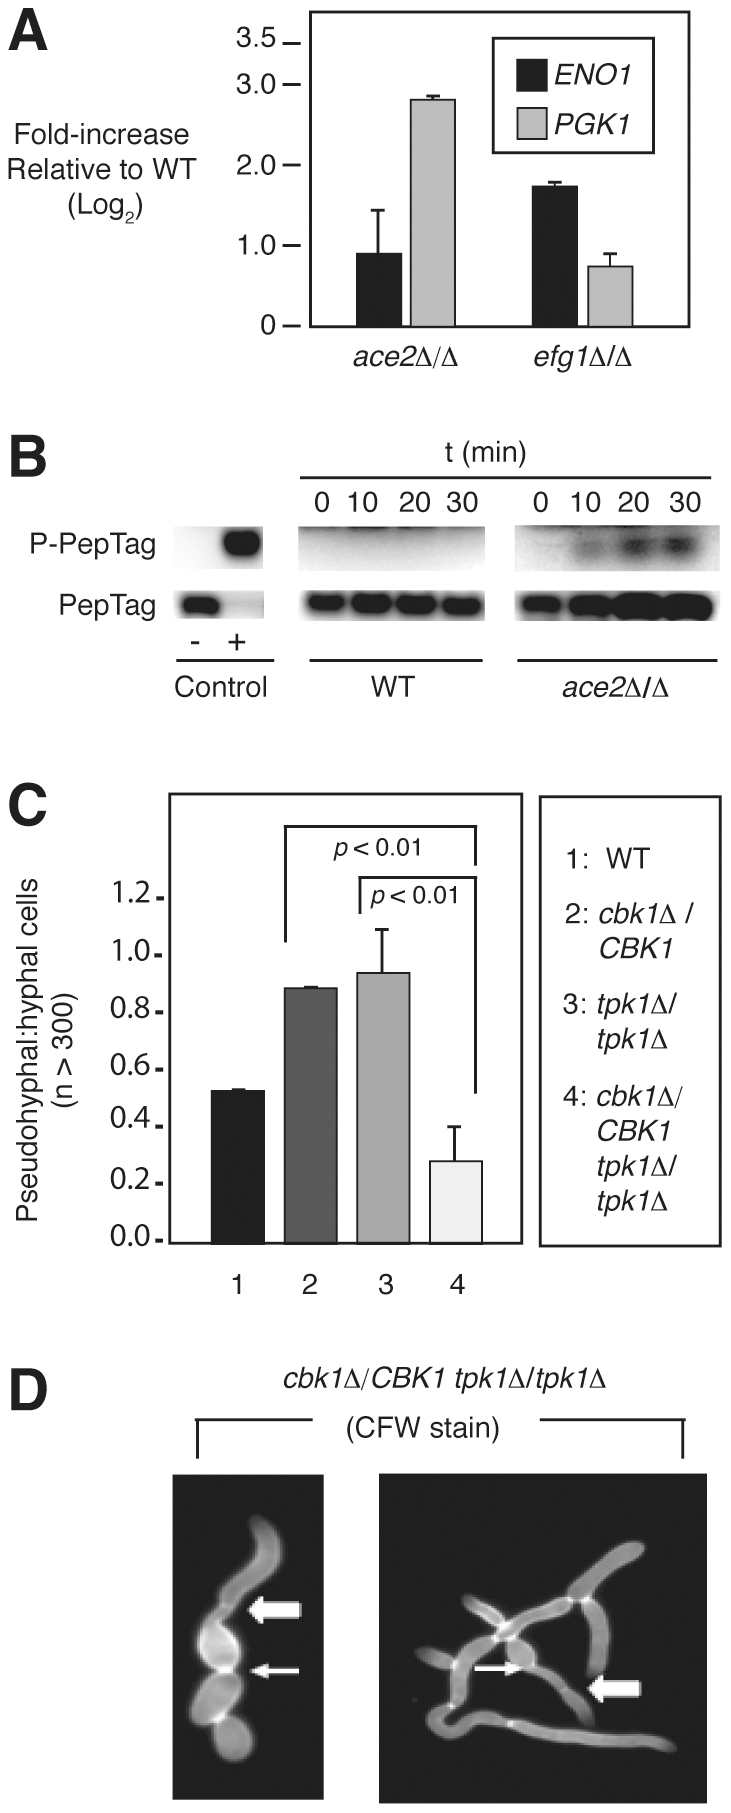
Figure 5. The PKA pathway compensates for decreased RAM pathway activity during morphogenesis.

(A) Transcript levels of ENO1 and PGK1 in each mutant were compared to wild type by qRT-PCR using the 2−ΔΔCt method and are graphed as Log2 change over wild type (three independent experiments performed in triplicate). Bars indicate mean value and error bars indicate standard deviation. The observed elevation in levels of each transcript in the indicated mutants relative to wild type were statistically significant by Student's t test (p<0.05). (B) Phosphorylation of fluorescent PKA substrate (PepTag, Promega) by cell extracts (10 µg protein) derived from wild type (WT) and ace2Δ/2Δ cells harvested after incubation in SM for 3 h at 37°C. The indicated time points represent PKA reaction time. (C) The ratio of pseudohyphal∶hyphal cells for the indicated strains was determined by light microscopy after 3 h incubation in liquid SM at 37°C. The bars indicate mean values of two-three independent replicates of at least 100 cells. Error bars indicate standard deviation. Brackets indicate the results of Student's t test evaluation of differences between the indicated mutants; p<0.05 indicates a statistically significant difference. (D) Hybrid pseudohyphae/hyphae cells of cbk1Δ/CBK1 tpk1Δ/1Δ following staining with Calcofluor white. Arrows indicate budneck localized septa (pseudohyphae-like) and block arrows indicate distal septa (hyphae-like).
