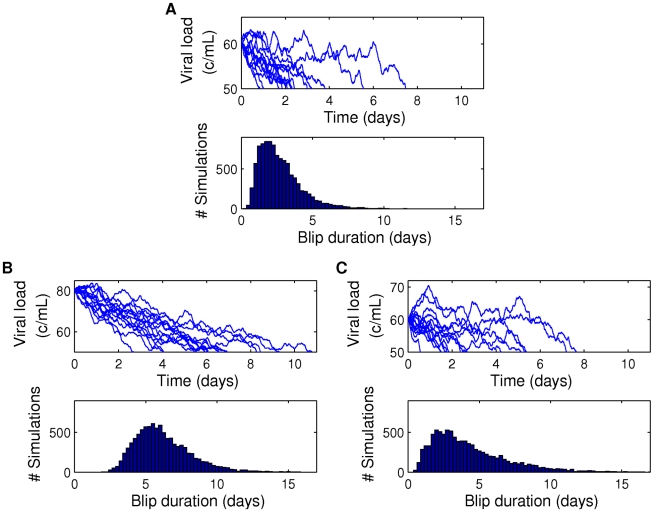
Figure 10. Realizations of Gillespie simulations showing viral load evolution.
(A–C) show sample viral load evolutions and the associated histogram of durations until the viral load is below 50, over 10000 simulations, given an initial viral load measurement and latent reservoir size. (A) Initial viral load measurement of 60 c/mL with latent reservoir size 1 per  cells; (B) initial viral load measurement of 80 c/mL with latent reservoir size 1 per
  cells; (C) initial viral load measurement of 60 c/mL with latent reservoir size 1.5 per
  cells. Parameters: Tables 1 and 2, for
  .
.

