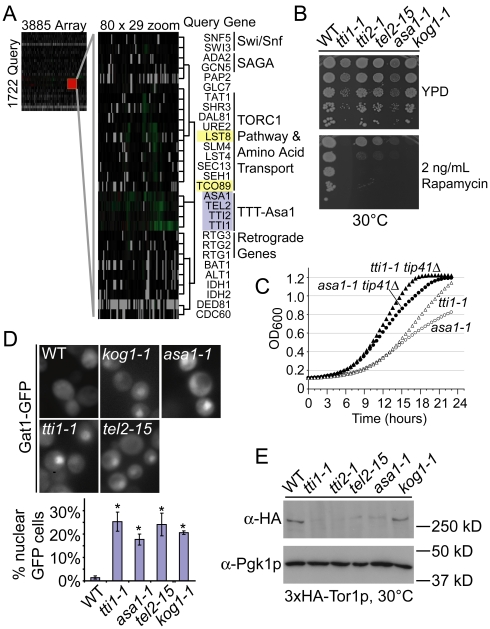
Figure 4. High-resolution phenotypic profiles link TTT and ASA1 to TORC1 function.
(A) Hierarchical clustering of genome-wide SGA profiles for TTT and ASA1 ts-alleles with the global genetic interaction network [29]. Queries are grey and TORC1 components are yellow. (B) Dilution series of TTT-Asa1 ts-allele growth +/− the TORC1 inhibitor rapamycin. (C) Growth curve analysis of hypomorphic tti1-1 and asa1-1 alleles in congenic strains +/− TIP41. (D) Localization of Gat1-GFP in TTT-Asa1 mutants. Below the sample images a graph shows the mean proportion of cells with nuclear GFP +/− SEM (* = p<0.01 compared to WT; tti2-1 not done). (E) Western blot analysis of 3xHA-Tor1p in the TTT-Asa1 ts-alleles including α-Pgk1p blots as a loading control.

