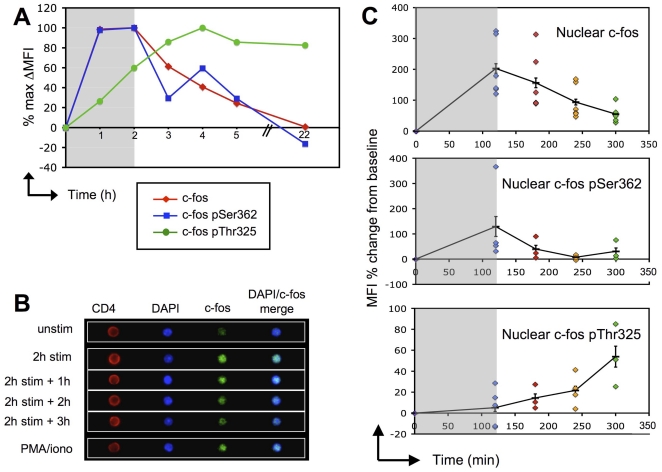
Figure 3. c-fos is rapidly induced and phosphorylated upon T cell stimulation and remains stable hours after stimulus withdrawal.
Kinetics of c-fos total protein and its phosphorylated forms in CD4 T cells during a 2 h stimulation with anti-CD3/anti-CD28 beads and 1 h, 2 h, 3 h or 20 h after removal of beads as determined by intracellular staining and FACS analysis. In order to display data from all 3 stainings in a single graph, results are shown as the percent of the maximum change of fluorescence observed for each antibody, e.g. c-fos MFI of the sample/(max c-fos MFI observed in the time course-baseline c-fos MFI)×100. B. Representative images taken by an imaging flow cytometer of CD4 T cells stained intracellularly for c-fos total protein and DAPI. Cells were either left unstimulated or stimulated for 2 h with anti-CD3/anti-CD28 beads, then harvested immediately or 1 h, 2 h or 3 h after stimulus withdrawal. A positive control sample was stimulated with PMA/ionomycin for 2 h. C. LN cells were stimulated 2 h with anti-CD3/anti-CD28 beads and harvested either immediately or 1 h, 2 h or 3 h after removal of beads. The cells were stained for CD4 and for total c-fos protein (top panel) or its phosphorylated forms, pSer362 (middle panel) or pThr325 (bottom panel) before analysis on an imaging flow cytometer. Colocalization with DAPI was used to determine nuclear localization in CD4+ T cells. Each dot represents a different sample. Results (mean±sem) are shown as the percent change in mean fluorescence intensity (MFI) from baseline levels in unstimulated T cells and are pooled from at least 3 independent experiments.

